Entering an era where Internet usage time is longer than TV usage time… Actual usage time of major media
Real-time TV viewing time varies by more than 3 times between age groups
Facts about "Young people are moving away from TV" and "Elderly people are not good at using the Internet" what is Based on the "2020 survey on information communication media usage time and information behavior" (*) announced by the Ministry of Internal Affairs and Communications in August 2021 as a survey result of the Information and Communications Policy Research Institute, it will be confirmed from the usage time.
The following shows the average usage time per day for the five major media (although TV is by viewing style) in the surveyed population and each age group. For example, 73.1 minutes is spent on television (real time) for teenagers, so it is calculated that teens watch TV for an average of 1 hour and 13 minutes on weekdays, including those who do not watch TV. Also, the Internet is not the time you connect the line, but the time you actually use it. On the other hand, the terminals used are not limited to personal computers, but also include smartphones, conventional mobile phones, tablet terminals, and the use of related services via televisions that can connect to the Internet.
Regarding "actions while doing", as far as the answer sheet is concerned, it can only be read as "applicable if it is performed continuously for 10 minutes or more", and the overlapping behavior is recorded as each action. For example, if there is time to read a newspaper while watching TV, it will be added to both the TV and the newspaper.
On average, about 163 minutes of real-time TV viewing and about 20 minutes of recorded viewing, totaling about 3 hours. Internet takes about 168 minutes, and newspapers and radio take around 10 minutes each. As usual in media-related surveys, it is obvious from the shape of the graph that there is a big difference by age group. Also, it is impressive that the Internet time is longer than the TV (real time) even in the overall value.
As you can see from the phrase ``young people are moving away from TV,'' TV viewing time is generally shorter for younger people and longer for older people. In particular, people in their 60s are longer, with an average of 271.4 minutes per day. I've been watching TV for about four and a half hours. On the other hand, the Internet usage time is the longest for those in their 20s, just over 4 hours. After that, the usage time tends to decrease, and it stays for a little over an hour and a half in the 60s.
The decline in newspaper subscribers and radio listeners is well-known, but among teenagers, both spend less than five minutes a day on average on weekdays. It's the same thing in your 20s, and in your 40s, the radio is only about 10 minutes long. In my 60s, I spend about 20 minutes a day on newspapers and radio.
Details of changes in one year
Next, we checked the situation as of the previous survey, that is, as of 2019, and calculated the difference from the 2020 results announced this time as follows. graph.
Assuming that changes of a few minutes are inconsistent and within the margin of error, Internet use increased in all age groups, TV (real time) increased in 30s and 60s, decreased in 20s, and 60s. The main movement is the decline of radio in
In 2020, television (real-time) showed an increase compared to the previous year, but if we check the movement over the past nine years for which records can be obtained, there are irregular movements here and there, but there is a decrease in almost every age group. looks like a trend.
However, it is also true that the rate of decline can be read to be rapid for the younger generation and slower for the middle-aged and older. The recent year-on-year growth in many age groups may be due to the increased time spent at home due to the novel coronavirus epidemic.
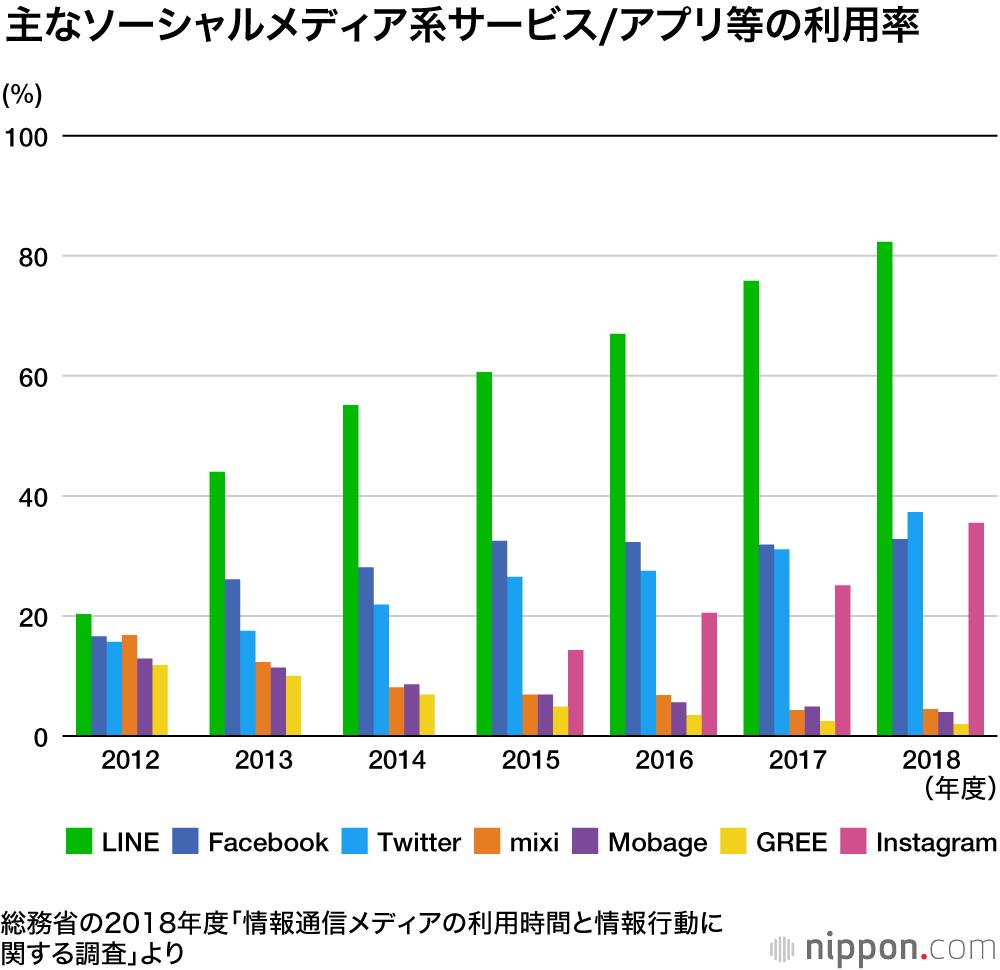
As of 2020, people in their teens to 40s spend more time on the Internet than on TV (real time). In other words, it is "the era of television < the Internet in the 40s and below." This is largely due to the spread of smartphones, and this trend will continue in the future.
■Related articles:
[TV is about 2 hours a day...Relationship with media for elementary school students]
[More than 30% on smartphones, more than half on internet terminals... Changes in media contact time (change over time) (latest)]
*FY2020 survey on information communication media usage time and information behavior
From January 12th to January 18th, 2021, random location quarter sampling of 125 points nationwide (randomly selecting survey points, assigning the number of samples to each point, and extracting survey subjects in the corresponding area) Method), and targeted 1500 samples of 13-69 years old by home visit detention survey method. A questionnaire survey and a diary survey were conducted simultaneously, the latter being conducted on two days on weekdays and one day on weekends. Therefore, although it is written as "teens" in the graph, it strictly means 13 to 19 years old.
Depending on the timing of the survey, some of the survey results show irregular movements, but the report states, "We cannot deny the impact of differences in survey timing and the possibility that this is a temporary trend for a single year. , It is necessary to take into consideration the results of future surveys, etc. to grasp continuous trends.” It should also be noted that it was done in
(Note) Unless otherwise specified, the graphs and charts in the text are quoted from or created by the author based on the materials.
(Note) Unless otherwise noted, the photographs in the text were created by the author based on the materials described in the text, or were taken by the author during interviews.
(Note) Numbers used in article titles, text, graphs, etc. may be written after rounding off any digits after the decimal point so that the display is considered optimal on the spot. I have. Therefore, the total number of figures on the display may not match exactly.
(Note) If the value at the end of the axis of the graph is set to a positive value other than zero in order to fix the appearance of the graph and make it easier to see the movement of the numbers, the value is enclosed in a circle or the like to call attention to it. There are cases.
(Note) In order to improve the appearance of the graph, some notation of items (such as okurigana) may be omitted or changed. Also, "~" may be expressed as "-".
(Note) "ppt" in the graph means % points.
(Note) "(Great) Earthquake" refers to the Great East Japan Earthquake unless otherwise specified.
(Note) This article is a partial addition and change to the article published in [Garbage News].


